
Growth
Subscribers and views as FameX records them
Subscribers
Daily snapshots stored by FameX
Monetization
YouTube Partner Program: 1,000 subscribers and 4,000 long-form watch hours in 12 months
Estimated from public YouTube data, not confirmed by YouTube. Watch hours estimated from lifetime views per year and recent uploads × typical watch time.
The formula
Niche, persona, format and what makes it work
Pop Culture and Historical Comparisons
Character morality ratings
The $[N] [X] That [benefit] Forever
See the full formula
Audience, title patterns, thumbnail style, offers and funnel.
Create a free accountWhy it's faceless
Compilation · confirmed · 100% confidence


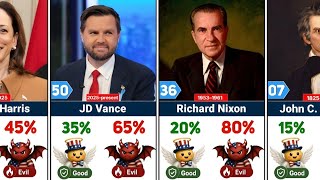


- 1Channel features comparison videos of public figures, fictional characters, and movies using compiled images, maps, and stats with voice-over narration, with no on-camera presenter.
Videos
5.0×4:18 3:26
 10.4×6:08
 7.5×6:56
 8:29
 9.8×4:13
 2.5×3:59
 8:13
 25.4×5:41
 8:02
 3:54
 2:47
 6:56
 6:40
 6:56
 20.2×6:35
 32.4×6:56
 2:47
 3:27
 3:27
How it makes money
Ad revenue estimate, products and where the channel sends viewers
How we estimated ad revenue
Last 30 days. Every step is shown, and the parts add up to the total.
An estimate from public data, not YouTube Analytics. Sponsorships, memberships and products aren't included.
What they sell
No product found yet.
Channels like The Data Comparison
Matched on what they publish, not just keywords. Inactive channels are left out.



Celebrity & Influencer Comparisons




Historical and Statistical Comparisons
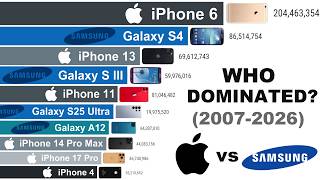
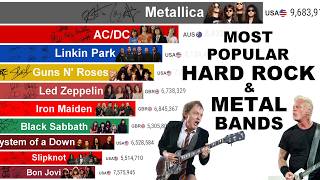

Data visualizations and bar chart races



Country comparisons and data visualizations



Historical data comparisons and rankings



Global statistics and country comparisons


data comparison and history



3D comparisons and rankings
Data from YouTube via YouTube API Services, refreshed hourly. Analysis by FameX — not YouTube data. Revenue is an estimate from niche RPM ranges.
About The Data Comparison
Is The Data Comparison a faceless channel?
Yes. FameX classifies The Data Comparison as a compilation channel (confirmed, 100% confidence). Channel features comparison videos of public figures, fictional characters, and movies using compiled images, maps, and stats with voice-over narration, with no on-camera presenter.
Is The Data Comparison monetized?
Probably. With 36,800 subscribers and an estimated 288,659 watch hours in the last 12 months, The Data Comparison appears to meet the YouTube Partner Program thresholds (1,000 subscribers and 4,000 long-form watch hours in 12 months). This is a FameX estimate, not confirmed by YouTube.
How much does The Data Comparison make?
FameX estimates The Data Comparison earns about $305–$684 a month from YouTube ads, based on 242K views in 30 days and a typical RPM for the history & culture niche. Sponsorships, memberships and product sales are not included.
What kind of videos does The Data Comparison post?
The Data Comparison makes pop Culture and Historical Comparisons; it uploads about 2.3 videos a week; typical videos run 6 minutes.
Data updated 20 Oct 2026. Subscriber and view counts come from the YouTube Data API; verdicts, monetization and revenue are FameX estimates. How FameX works · More history & culture channels