How We Broke the Ozone Layer and Started Fixing It
Long-form6:38
Published Sep 16, 2026, 4:00 PM · 4w ago

Cosmoknowledge Simulated
15.7K subscribers · median 1.4K views
Animation · confirmed$Likely
Views
1,622
+0 views/hour
Likes
50
3.1% of views
Comments
4
0.25% of views
Checked every 24 h while the video is this age · last check 15h ago · next in 508 min. YouTube itself updates public counts with a short delay.
Views / hour now
0
measured 15h ago
Peak views / hour
—
Avg views / day
54
since upload
First 24 hours
—
not tracked from upload
vs channel median
1.2×
Rank in channel
#11
of 23 tracked
Engagement
3.3%
likes + comments / views
Est. ad revenue
$6–$16
lifetime, $4–10 RPM
Views over time
4 readings · line: total views · bars: views gained per hour
Description
We damaged Earth’s protective ozone layer. Then the world acted to help it recover.
Watch 150 years of ozone history unfold, from an illustrative 1950 baseline through satellite observations and a projected future to 2100. Discover how CFCs fuelled ozone destruction, why Antarctica was hit hardest, and how the Montreal Protocol helped change the trajectory.
Recovery takes decades, and weather can make the hole shrink or grow dramatically from one year to the next.
The historical animation uses NASA ozone maps from 24 September, 1979–2025, comparing the same date across available years. We smoothly interpolated between maps and estimated missing areas, including the 1995 gap, to avoid distracting visual artifacts.
The colors represent ozone concentration. Purple shows severe thinning, not a physical opening in Earth. The atmospheric glow and layer thickness are illustrative.
Before 1979 and after 2025, the visuals are illustrative—not satellite observations. The future sequence draws on published recovery assessments, rather than a new atmospheric model. Recovery dates are approximate and depend on continued controls on ozone-depleting substances.
Sources and credits:
NASA Ozone Watch - maps and observations
https://ozonewatch.gsfc.nasa.gov/data/
NASA - annual ozone-hole statistics
https://ozonewatch.gsfc.nasa.gov/statistics/annual_data.html
NOAA - Ozone Depleting Gas Index
https://gml.noaa.gov/odgi/
UNEP - Montreal Protocol
https://ozone.unep.org/treaties/montreal-protocol
WMO/UNEP - Scientific Assessment of Ozone Depletion, 2022
https://csl.noaa.gov/assessments/ozone/2022/executivesummary/
British Antarctic Survey - discovery of the ozone hole
https://www.bas.ac.uk/about/history/ozone-hole-discovery/
-------
For more astronomy, space exploration, and science content, check out our parent channel, @Cosmoknowledge.
Tags
ozone layerozone holeozone recoveryozone depletionMontreal ProtocolCFCsAntarcticaNASAEarth scienceatmosphereenvironmental scienceozone animationEarth timelapsescience documentaryUV radiation
Details
- Published
- Sep 16, 2026, 4:00 PM
- Length
- 6:38 (398 s)
- Format
- Long-form
- Category
- —
- Audio language
- —
- Quality
- —
- Captions
- —
- Made for kids
- —
- Licensed content
- —
- Video ID
- o_-3j0rUXPQ
More from Cosmoknowledge Simulated
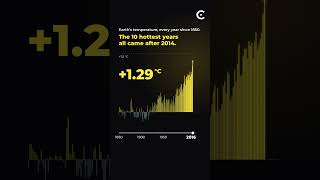 Global warming is getting out of hand.185 views · 8h ago · +56/h
 How 6 Countries Became the European Union: Every Year Mapped81 views · 1d ago
 How your body builds a protein.1.2K views · 1d ago
 Canada vs Brazil in the new official world map. #earth #canada58 views · 3d ago · +1/h
 The Rise and Fall of the Roman Empire: Every Year Mapped9.8K views · 4d ago · +197/h
 From just 6 countries to 27. Watch how the European Union evolved over time.1.8K views · 5d ago · +1/h
 Watch the Roman Empire rise and fall, from the founding of Rome to the fall of Constantinople.3.4K views · 1w ago
 800 Years of Rocket Engines, To Scale1.1K views · 1w ago · +1/h
Statistics from the YouTube Data API, tracked by FameX. Views per hour, revenue and comparisons are FameX estimates.