FameXOtherInfoZoom
InfoZoom

InfoZoom

@infozoomx
134K subscribers236 videos32.9M viewsAUen6.3y old
Animation · confirmed$Likely monetizedOther
Channel statsLifetime · refreshed hourly
Subscribers
134K
0 · 2d
Views / hour
6.3K
recent uploads · 88.5K in 24 h
Views 7d
636K
over 2 days so far
Total views
32.9M
236 videos
Uploads / week
10.3
8 min median
Median views
20.2K
last 20 uploads
Outlier
1.7×
vs niche median
Ad revenue 30d
$53K–141K
see how we estimated it

Growth

Subscribers and views as FameX records them

Subscribers

Daily snapshots stored by FameX

Monetization

YouTube Partner Program: 1,000 subscribers and 4,000 long-form watch hours in 12 months

$Likely monetized
Subscribers134K / 1K
Watch hours (12 mo, est.)634K / 4K

Estimated from public YouTube data, not confirmed by YouTube. Watch hours estimated from lifetime views per year and recent uploads × typical watch time.

The formula

Niche, persona, format and what makes it work

Niche

Data Visualization & Statistics

Content pillar

Data Presentation

Title patterns

The $[N] [X] That [benefit] Forever

See the full formula

Audience, title patterns, thumbnail style and why it works.

See plans

Why it's faceless

Animation · confirmed · 100% confidence

The evidence
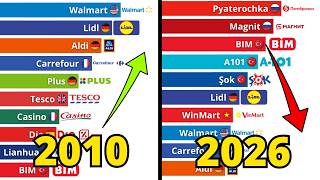
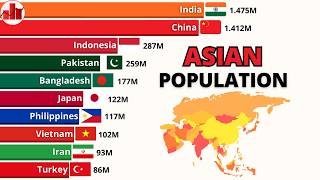
  • 1The channel consistently uses animated bar chart races and data visualizations. No real people are shown presenting. The thumbnails feature graphics and data representations rather than individuals.

Videos

8:05
World Wheat Production Race | 1961–2026
865 views · 8h ago
8:05
200 Years of Military History: The Largest Armies Ranked
2.8K views · 1d ago
8:05
Largest Navies in the World by Tonnage | 1866–2026
16.4K views · 2d ago
8:01
The Rise and Fall of iPhone Models | 2007–2026
5.7K views · 3d ago
8.4×8:06
Most Visited Countries Every Year | 1980–2026🌍✈️
169K views · 4d ago
8:05
Most Followed Instagram Accounts (2012–2026)
2.6K views · 5d ago
7.0×8:02
World’s Largest Companies by Market Cap | 1980–2026
141K views · 5d ago
8:02
Which Chocolate Sold the Most? (2000–2026)
8K views · 6d ago
8:05
Rice Production by Country | 1961–2026
8.9K views · 6d ago
8:03
Top 20 Deadliest Wars in Human History 1200 - 2026
4.7K views · 1w ago
8:04
How Ukraine's Regions Changed Over 66 Years (1960–2026)
37.6K views · 1w ago
3.5×8:05
Olive Oil Production by Country 1961–2026
69.3K views · 1w ago
4.7×8:02
Which Motorcycle Sold the Most? (1990–2026)
93.2K views · 1w ago
14.8×8:02
Motorcycle Production by Country | 1980–2026
297K views · 1w ago
7.9×8:02
Best-Selling Mobile Phone Models Every Year |1994 2026
158K views · 1w ago
4.8×8:02
World's Best Goalkeepers by Year | 1987–2025
96.8K views · 1w ago
8:02
Saudi Arabia's Largest Nationality Groups | 1992–2026
25.8K views · 1w ago
8:02
Thailand's Ethnic Groups: Who Grew the Most?
8.6K views · 1w ago
8:00
Which Saudi Province Has the Most People? | 1974–2026
24K views · 1w ago
8:00
How Colombia's Departments Changed by Population 1951–2026
11.3K views · 1w ago

How it makes money

Ad revenue estimate, products and where the channel sends viewers

How we estimated ad revenue

Last 30 days

Estimated total$53,050–$141,467

See every step: niche RPM, audience and length adjustments, long-form and Shorts.

What they sell

No product found yet.

Channels like InfoZoom

Matched on what they publish, not just keywords. Inactive channels are left out.

26.3×
Global Stats
Global Stats
@globalstats · 7.4y old

Data visualizations and bar chart races

73% similar · shares data visualization, statistics
Subs
336K
7 days
+875
Sells
—
Animation · confirmed$LikelyHistory & culture
New
TES Data
TES Data
@tesdatayt · 11mo old

Data Visualization and Trends

72% similar · shares data visualization, global trends
Subs
5.4K
7 days
0
Sells
—
Animation · confirmed$LikelyFinance & business
New
Keyson Stats
Keyson Stats
@keysonstats · 4.9y old

data visualization and historical rankings

70% similar · shares data visualization, statistics
Subs
195K
7 days
0
Sells
—
Animation · confirmed$LikelyEducation & explainers
New
Data Castle
Data Castle
@datacastle · 2.5y old

Sports Statistics and History

70% similar · shares data visualization, statistics
Subs
9.2K
7 days
+20
Sells
—
Animation · confirmed$LikelyOther
Datadotcom
Datadotcom
@datadotcom · 3.9y old

Country comparisons and data visualizations

67% similar · shares infographics
Subs
15.1K
7 days
0
Sells
—
Animation · confirmed$LikelyEducation & explainers
New
NumbersThatSing
NumbersThatSing
@numbersthatsing · 4mo old

Data Visualization History

66% similar · shares data visualization, graphs
Subs
1.2K
7 days
−10
Sells
—
Animation · confirmed0%History & culture
THE MOST
THE MOST
@listofthemost · 20mo old

Global statistics and country comparisons

65% similar · shares data visualization
Subs
7.1K
7 days
+26
Sells
—
Animation · confirmed$LikelyEducation & explainers
New2.4×
Wolf Data
Wolf Data
@wolfdata_1 · 2.1y old

data visualization and historical statistics

65% similar · shares charts, data visualization, statistics
Subs
80.7K
7 days
0
Sells
—
Animation · confirmed$LikelyEducation & explainers

Data from YouTube via YouTube API Services, refreshed hourly. Analysis by FameX — not YouTube data. Revenue is an estimate from niche RPM ranges.

About InfoZoom

Is InfoZoom a faceless channel?

Yes. FameX classifies InfoZoom as a animation channel (confirmed, 100% confidence). The channel consistently uses animated bar chart races and data visualizations. No real people are shown presenting. The thumbnails feature graphics and data representations rather than individuals.

Is InfoZoom monetized?

Probably. With 134,000 subscribers and an estimated 633,836 watch hours in the last 12 months, InfoZoom appears to meet the YouTube Partner Program thresholds (1,000 subscribers and 4,000 long-form watch hours in 12 months). This is a FameX estimate, not confirmed by YouTube.

How much does InfoZoom make?

FameX estimates InfoZoom earns about $53,050–$141,467 a month from YouTube ads, based on 17.7M views in 30 days and a typical RPM for the other niche. Sponsorships, memberships and product sales are not included.

How fast is InfoZoom growing?

In the last 2 days, InfoZoom gained 0 subscribers and got 635,773 channel views. It has 134,000 subscribers and 32,939,783 total views.

What kind of videos does InfoZoom post?

InfoZoom makes data Visualization & Statistics; it uploads about 10.3 videos a week; typical videos run 8 minutes.

Data updated 23 Oct 2026. Subscriber and view counts come from the YouTube Data API; verdicts, monetization and revenue are FameX estimates. How FameX works · More other channels