TES Data

TES Data

@tesdatayt
5.4K subscribers55 videos2.6M viewsCLen11mo old
Animation · confirmed$Likely monetizedFinance & business
Channel statsLifetime · refreshed hourly
Subscribers
5.4K
0 · 2d
Views / hour
420
recent uploads · 10K in 24 h
Views 7d
25.8K
over 2 days so far
Total views
2.6M
55 videos
Uploads / week
0.9
8 min median
Median views
5.1K
last 20 uploads
Outlier
0.8×
vs niche median
Ad revenue 30d
$7.2K–17.2K
see how we estimated it

Growth

Subscribers and views as FameX records them

Subscribers

Daily snapshots stored by FameX

Monetization

YouTube Partner Program: 1,000 subscribers and 4,000 long-form watch hours in 12 months

$Likely monetized
Subscribers5.4K / 1K
Watch hours (12 mo, est.)127K / 4K

Estimated from public YouTube data, not confirmed by YouTube. Watch hours estimated from lifetime views (channel under a year old) × typical watch time.

The formula

Niche, persona, format and what makes it work

Niche

Data Visualization and Trends

Content pillar

Data Analysis

Title patterns

The $[N] [X] That [benefit] Forever

See the full formula

Audience, title patterns, thumbnail style and why it works.

See plans

Why it's faceless

Animation · confirmed · 100% confidence

The evidence
  • 1The channel's about text explicitly states that the videos feature 'animated graphics' and that viewers will be accompanied by 'Zoro, our little red fox, who will guide you through each graphic'. The thumbnails and video titles consistently show data visualizations and rankings, which are presented through animation and graphics, not live-action footage or a human presenter.

Videos

8:06
The Rise and Fall of the Greatest Oil Producers | 1950-2026
531 views · 3d ago
8:03
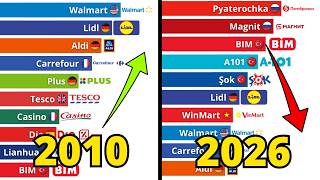
Rise and Fall of the Largest Supermarket Chains | 1980-2026
2.7K views · 1w ago
10:12
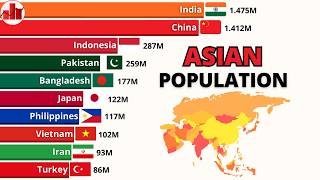
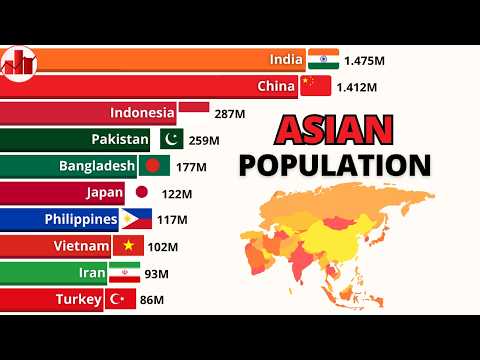
Population of Asia by COUNTRY 1800-2026
1.1K views · 2w ago
8:03
The Rise and Fall of the Best-Selling Smartwatch Brands | 2015-2026
8.3K views · 3w ago
9:13
The Rise and Fall of Fast Food Chains With The Most Locations | 1970-2026
3.2K views · 4w ago
111.7×9:53
The Rise and Fall of the Most Used Artificial Intelligences | 2022-2026
581K views · 4w ago
5:29
Largest Airports by Number of Passengers - 2000-2026
4.3K views · 5w ago
8:08
Netflix Vs Prime Video | Streaming Platforms with the Most Subscriptions - 2007-2026
5.4K views · 6w ago
26.1×8:24
The Race and Fall of the Best Selling Camera Brands - 1990-2026
134K views · 8w ago
3.4×9:12
American Airlines Vs Delta | Airlines With The Most Passengers - 1960-2026
17.2K views · 2mo ago
10.5×8:33
Nike Vs Adidas | Best Selling Sneaker Brands - 1995-2026
53.9K views · 2mo ago
5:13
Android vs iOS | Most Popular Mobile Operating Systems - 1998-2026
4.1K views · 2mo ago
9:14
Most Subscribed YouTube Channels | MrBeast From 0 to 500M
1.2K views · 2mo ago
10:29
Ford Vs Tesla | Best Selling Car Models - 1920-2025
4.9K views · 3mo ago
12.8×8:13
Best Selling Motorcycle Brands | 1960-2026
65.6K views · 3mo ago
8:13
Most Used Graphics Cards | 2008-2026
2.3K views · 3mo ago
8:13
Best Selling Mobile Phones by Year | 1990-2026
7.4K views · 3mo ago
8:13
Top 15 Largest Semiconductor Producing Countries | 1980-2026
8.7K views · 4mo ago
8:13
Most Powerful CPUs - AMD Ryzen vs Intel Core | 2011-2026
2K views · 4mo ago
8:13
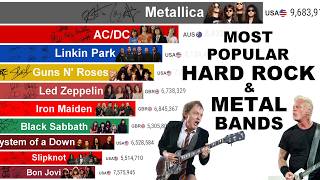
Top Selling Musical Artists of all Time | 1969-2026
5.5K views · 4mo ago

How it makes money

Ad revenue estimate, products and where the channel sends viewers

How we estimated ad revenue

Last 30 days

Estimated total$7,163–$17,192

See every step: niche RPM, audience and length adjustments, long-form and Shorts.

What they sell

No product found yet.

Channels like TES Data

Matched on what they publish, not just keywords. Inactive channels are left out.

New1.7×
InfoZoom
InfoZoom
@infozoomx · 6.3y old

Data Visualization & Statistics

72% similar · shares data visualization, global trends
Subs
134K
7 days
0
Sells
—
Animation · confirmed$LikelyOther
New
Data EYE
Data EYE
@dataeye2 · 6.2y old

Demographics and historical trends

71% similar · shares demographics, geopolitics, history
Subs
68.5K
7 days
0
Sells
—
AI imagery · likely$LikelyHistory & culture
2.2×
The Data Inspector
The Data Inspector
@thedatainspector · 7mo old

global data comparisons and rankings
68% similar · shares data visualization
Subs
8.4K
7 days
+79
Sells
—
AI imagery · confirmed$LikelyEducation & explainers
26.3×
Global Stats
Global Stats
@globalstats · 7.4y old

Data visualizations and bar chart races

68% similar · shares data visualization, rankings
Subs
336K
7 days
+875
Sells
—
Animation · confirmed$LikelyHistory & culture
New2.4×
Wolf Data
Wolf Data
@wolfdata_1 · 2.1y old

data visualization and historical statistics

67% similar · shares data visualization, history, rankings
Subs
80.7K
7 days
0
Sells
—
Animation · confirmed$LikelyEducation & explainers
New
Keyson Stats
Keyson Stats
@keysonstats · 4.9y old

data visualization and historical rankings

66% similar · shares data visualization
Subs
195K
7 days
0
Sells
—
Animation · confirmed$LikelyEducation & explainers
New
Dastatistics
Dastatistics
@dastatisticsofficial · 3.1y old

data comparisons

65% similar · shares data visualization, rankings
Subs
73.1K
7 days
0
Sells
—
Animation · confirmed$LikelyEducation & explainers
THE MOST
THE MOST
@listofthemost · 20mo old

Global statistics and country comparisons

65% similar · shares data visualization, demographics
Subs
7.1K
7 days
+26
Sells
—
Animation · confirmed$LikelyEducation & explainers

Data from YouTube via YouTube API Services, refreshed hourly. Analysis by FameX — not YouTube data. Revenue is an estimate from niche RPM ranges.

About TES Data

Is TES Data a faceless channel?

Yes. FameX classifies TES Data as a animation channel (confirmed, 100% confidence). The channel's about text explicitly states that the videos feature 'animated graphics' and that viewers will be accompanied by 'Zoro, our little red fox, who will guide you through each graphic'. The thumbnails and video titles consistently show data visualizations and rankings, which are presented through animation and graphics, not live-action footage or a human presenter.

Is TES Data monetized?

Probably. With 5,420 subscribers and an estimated 126,707 watch hours in the last 12 months, TES Data appears to meet the YouTube Partner Program thresholds (1,000 subscribers and 4,000 long-form watch hours in 12 months). This is a FameX estimate, not confirmed by YouTube.

How much does TES Data make?

FameX estimates TES Data earns about $7,163–$17,192 a month from YouTube ads, based on 716K views in 30 days and a typical RPM for the finance & business niche. Sponsorships, memberships and product sales are not included.

How fast is TES Data growing?

In the last 2 days, TES Data gained 0 subscribers and got 25,752 channel views. It has 5,420 subscribers and 2,643,551 total views.

What kind of videos does TES Data post?

TES Data makes data Visualization and Trends; it uploads about 0.9 videos a week; typical videos run 8 minutes.

Data updated 23 Oct 2026. Subscriber and view counts come from the YouTube Data API; verdicts, monetization and revenue are FameX estimates. How FameX works · More finance & business channels