Countries Resized by Nominal GDP in the Americas (1970 – 2031)
Long-form8:05EntertainmentPublished Oct 22, 2026, 11:30 AM · 12h ago

Views
527
+0 views/hour
Views / hour now
0
measured 5m ago
Peak views / hour
218
33m ago
First 24 hours
—
not tracked from upload
Engagement
3.2%
likes + comments / views
Likes
15
2.9% of views
Comments
2
0.38% of views
Est. ad revenue
$2–$4
lifetime, $3–8 RPM
Checked every 30 min while the video is this age · last check 5m ago · next in 25 min. YouTube itself updates public counts with a short delay.
Avg views / day
527
since upload
vs channel median
0.4×
this video's views ÷ the channel's usual
Rank in channel
#20
of 22 tracked
Views over time
26 readings
Total views Views gained per hour
Description
This video redraws the map of the Americas so that every country and territory is the size of its economy in today's borders, from 1970 to 2031.
GDP is at market exchange rates in current US dollars, so the United States is drawn larger than at PPP; UN figures run to 2024 with IMF projections after.
Data sources: UNdata - UN Statistics Division, National Accounts Main Aggregates Database; IMF World Economic Outlook (April 2026); borders from Natural Earth.
Subscribe for more data rankings and comparisons! 🐧
#UnitedStates #Brazil #Canada #Mexico #Argentina #GDP #Americas #Cartogram
Tags
economygdpworld economylargest economieseconomic growthcountry comparisondata visualizationanimated datainfographicstatisticsrankingcomparisonUnited StatesCanadaMexicoBrazilArgentina
Details
- Published
- Oct 22, 2026, 11:30 AM
- Length
- 8:05 (485 s)
- Format
- Long-form
- Category
- Entertainment
- Audio language
- EN
- Quality
- HD
- Captions
- No
- Made for kids
- No
- Licensed content
- Yes
- Video ID
- B2ITJV8g2mU
More from Data Penguin
 Countries Resized by Nominal GDP in the Americas2.5K views · 12h ago · +106/h
 YouTube Music vs Every Country's Population1.5K views · 1d ago
 YouTube Music Subscribers vs Every Country's Population2.4K views · 1d ago · +11/h
 Countries Resized by Nominal GDP in Oceania8.5K views · 2d ago · +77/h
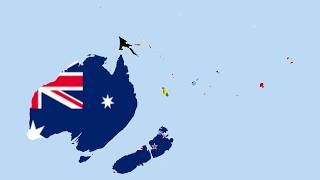 Countries Resized by Nominal GDP in Oceania (1970 – 2031)1.4K views · 2d ago · +4/h
 5-Minute Crafts vs Every Country's Population9.1K views · 3d ago · +33/h
 5-Minute Crafts Subscribers vs Every Country's Population1.4K views · 3d ago · +6/h
 Countries Resized by Nominal GDP in Africa18K views · 4d ago · +13/h
Statistics from the YouTube Data API, tracked by FameX. Views per hour, revenue and comparisons are FameX estimates.